

The portal your clients log into — on your brand.
Built for inventory companies. Vue turns every count you deliver into a branded dashboard your clients can self-serve — and gives your own leadership the executive view of the business. Who it's for: founders who need a polished client deliverable on day one, and established firms tired of emailing PDF reports.
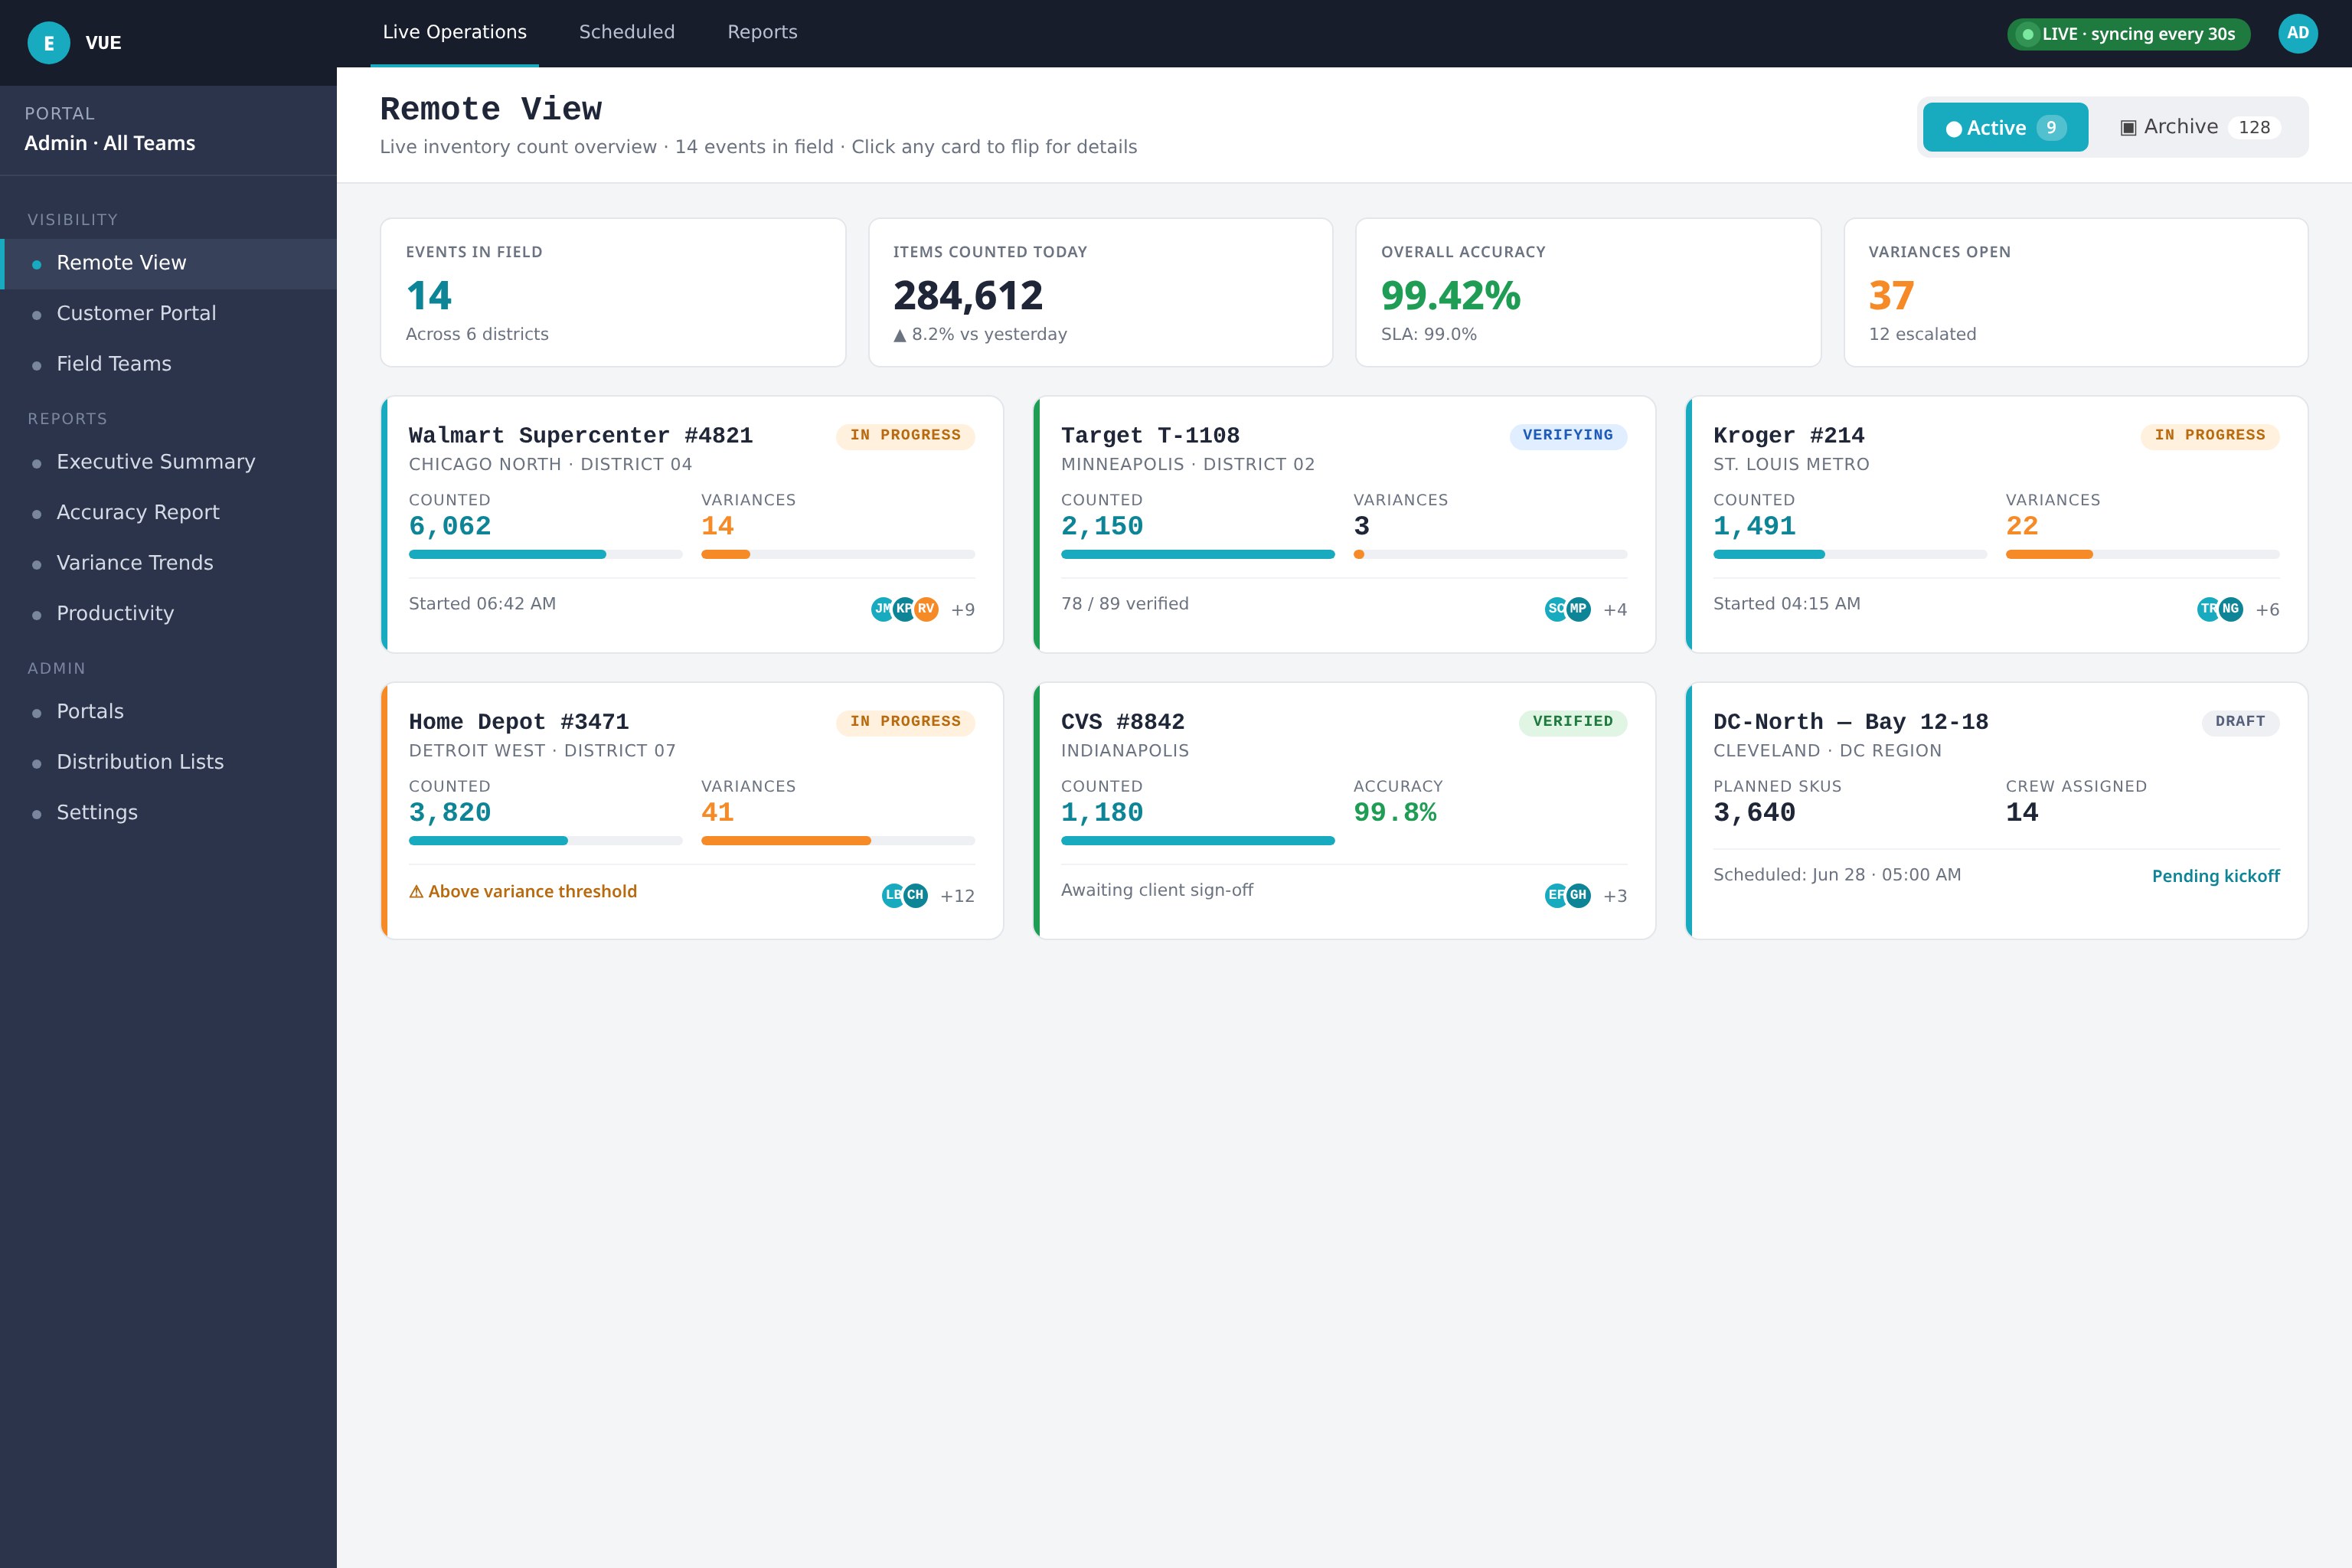
From a count on the floor to a number in the boardroom.
Executive dashboards
Roll up accuracy, productivity, and shrink across regions, customers, and lines of business.
Client portals
Give every customer a branded portal with their inventory truth — no email attachments required.
Custom reports
Drag-and-drop report builder with scheduled delivery, slicing, and export to anything.
Trend analytics
Compare cycles, seasons, and locations — and spot the divergences before they cost you.
API access
Push Echelon data into your warehouse, BI tool, or finance system with a clean REST API.
Always-on visibility
Real-time data refresh — the dashboard on the wall is always within seconds of the floor.
The inventory truth, at a glance.
Executive dashboards, client portals, and trend analytics — all built on a single source of operational truth.
The number you trust enough to forecast on.
Vue rolls every count, every variance, and every correction into the same KPI fabric — so the inventory line in your financial model is the same line your store manager sees.
The view that tells you exactly where to go next.
Location heatmaps, SKU-level variance alerts, and side-by-side cycle comparisons turn data into the next action — for the team on shift, not the analyst at HQ.
See your clients' data inside Vue.
Send us a sample export from one of your accounts — we'll mock up the branded portal your client would log into.